- Superimposed Dead Load = 10 psf
- Live Load = 40 psf (reducible) + 15 psf (non-reducible)
- 2-hour Fire Resistance Rating
BAY DESIGN STUDY
24'x24' Mild-Reinforced Concrete Flat Plate Multifamily Residential Bay
Design Commentary
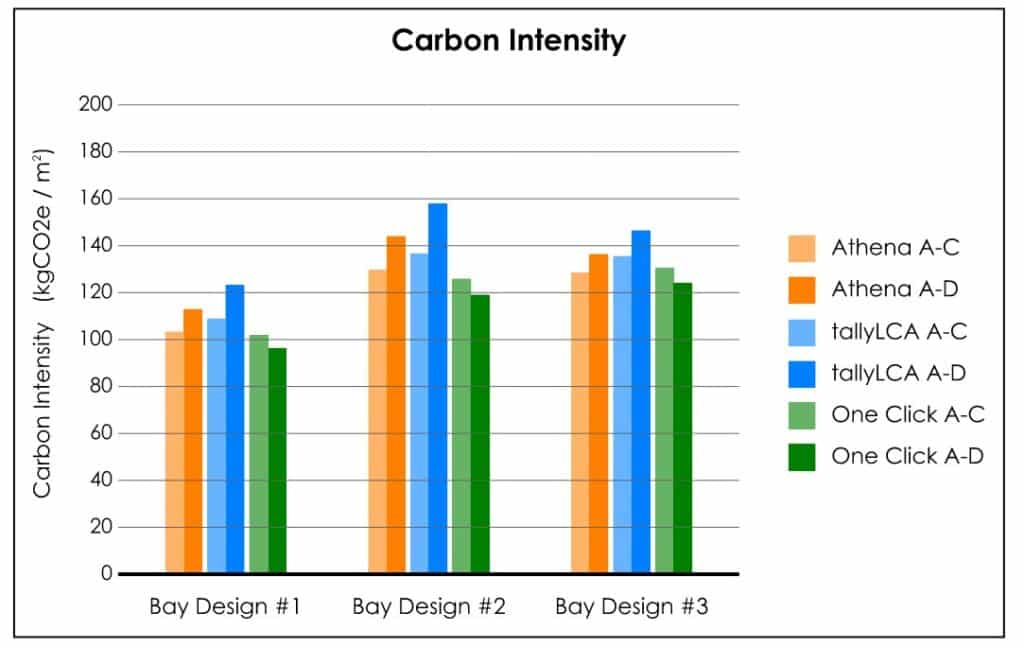
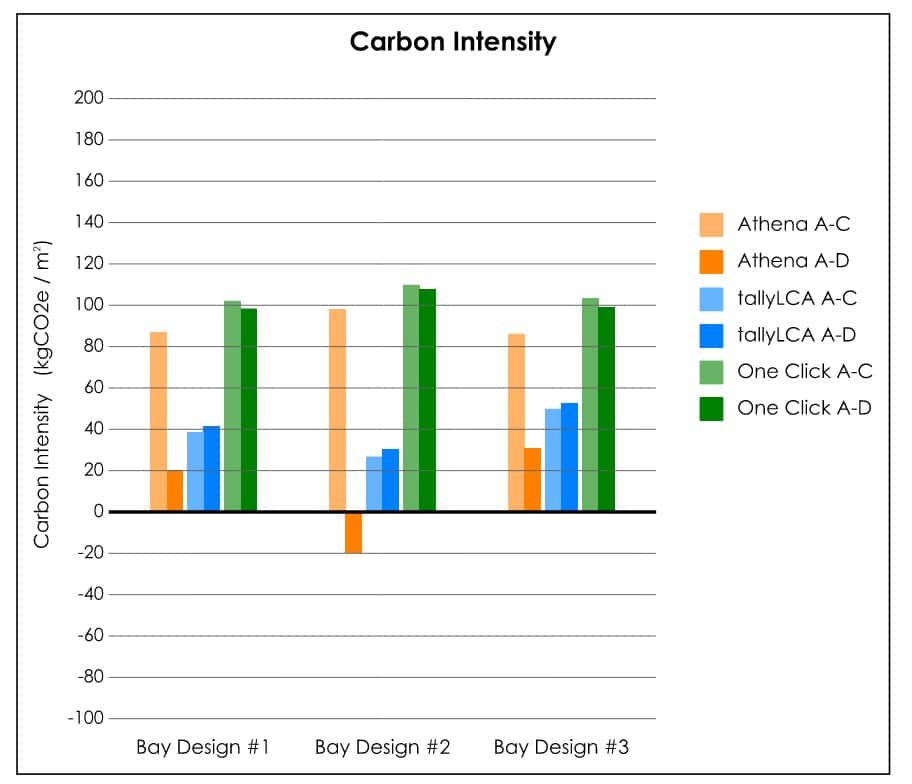
- Design variability results in total GWP variability of about 15% from the mean.
- All designers chose the same concrete strength of 4,000 psi, but the thickness of the slab varied from 7 1/2″ to 10″ which was the primary driver of GWP variability.
- Concrete accounts for 86% (std deviation = 8%) of total bay GWP.
- One designer included stud rails. In an embodied carbon analysis, these are essentially negligible.
- Concrete GWP is consistent between the three different tools – variability is only 7%.
- Rebar GWP is similar between tallyLCA and Athena IE but is substantially lower for One Click LCA.
- One Click LCA is 36% lower for A-C. One Click LCA offers more options for specific products and perhaps would not have been as much of an outlier if a different material had been used. The material used is “reinforcement, 98%.”
- It can be seen in the graphs that including Module D increases the total GWP for the LCAs done in tallyLCA and Athena, while it slightly decreases total GWP in One Click LCA. This is due primarily to how these tools treat rebar in Module D. Athena considers a positive Module D value for steel products when the recycled percentage at end-of-life is less than the input recycled percentage (see notes in commentary above). It is likely that tallyLCA does the same. It is not clear what One Click LCA’s assumptions are.
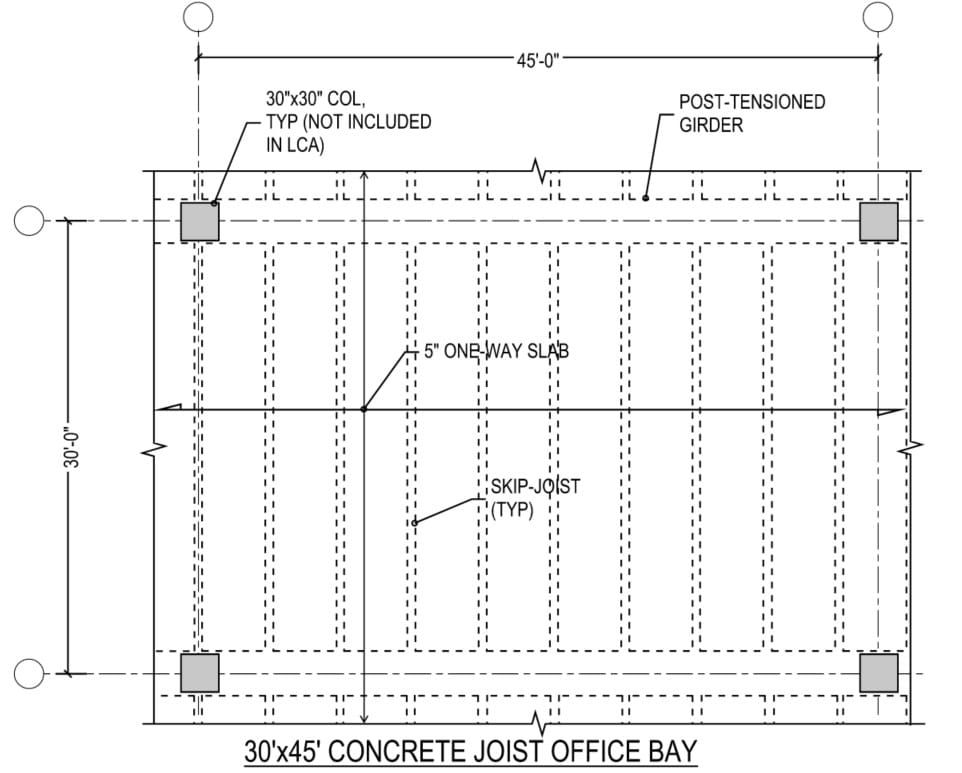
30'x45' Concrete Joist Office Bay
Bay Comparison Summary
| Concrete | Concrete strength in all the 3 bays is assumed as 5 ksi
Pan width (joist spacing) varies from 30” to 66” Joist/girder depth varies from 13” to 21” All joists are 6” wide Girder width ranges from 30” to 36” |
| Mild-Steel Reinforcement | Grade 60 ranges from 1.97 psf to 3.7 psf
Grade 75 ranges from 0 to 1.22 psf |
| Post Tensioning
Tendons |
PT Tendons per girder ranges from 10 to 17 tendons (½” dia. 7-strand, 270 ksi) |
Design Commentary
- The PT quantity in Bay #3 is 35-40% lower compared to Bay #1 and #2 (within 10% difference between the two designs).
- Bay #1 assumed the deepest joists (21” deep) compared to 16” deep in Bay #2 and 13” deep in Bay #3, yielding the highest concrete yardage for Bay #1 compared to the other two designs.
- The LCA results are pretty consistent, with the Bay #1 design having the highest impacts followed by the Bay #2 and Bay #3 designs. These results are in part because wider girders and deeper joists were assumed for Bay #1 resulting in greater concrete usage compared to Bays #2 and #3 . Shallower depth joists were used for Bay #3 but the reduction in volume of concrete per joist was offset by the required reduced spacing between the pans.
- Bay #3 design has less concrete and PT, but more rebar. Bay #1 and Bay #2 designs have similar material quantities.
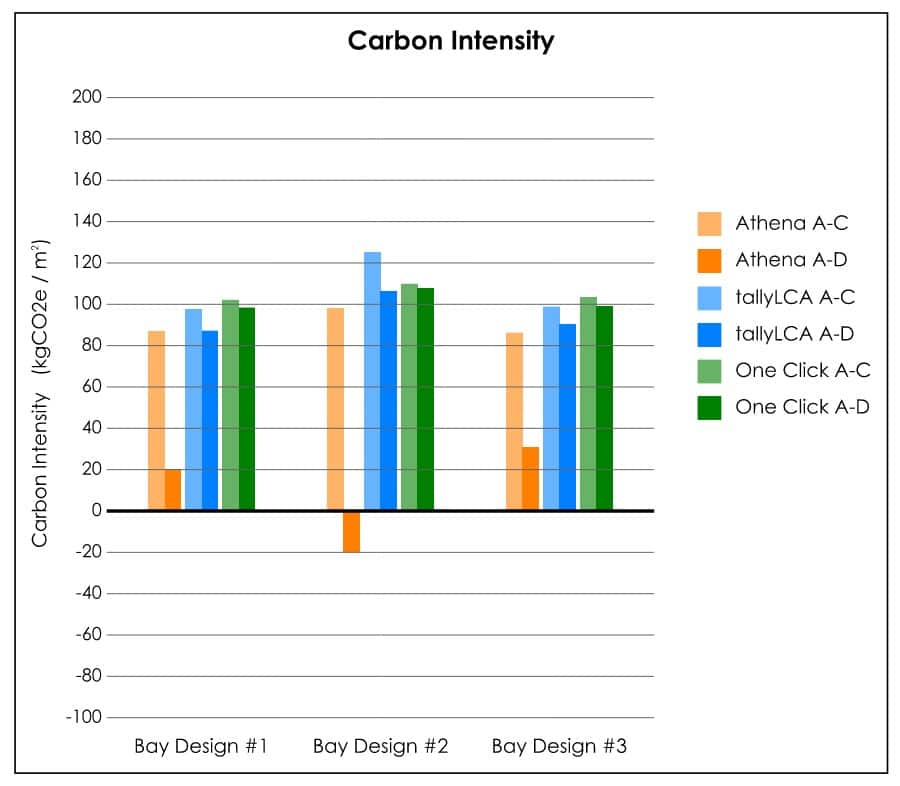
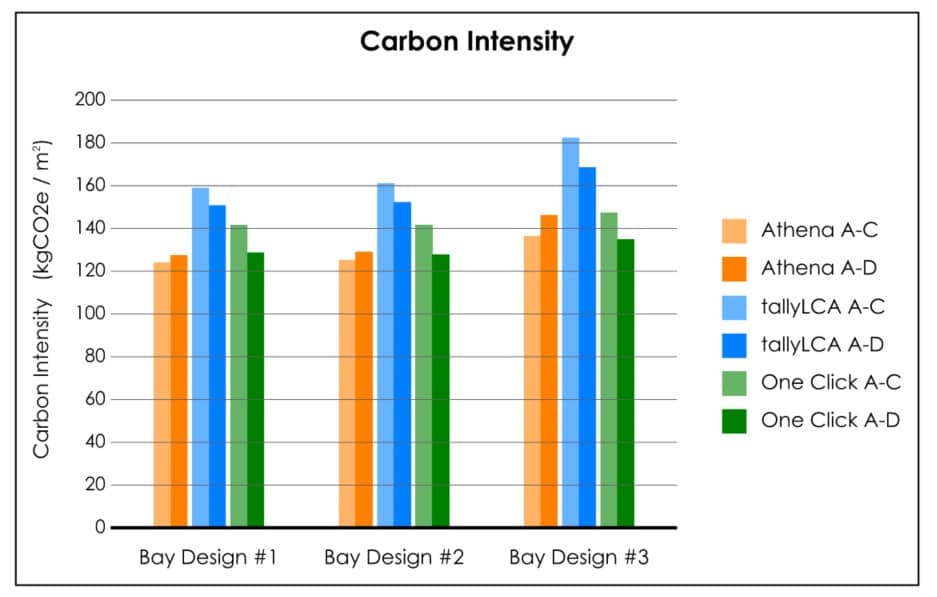
- The A-C impacts for each design are very consistent for the three tools.
- The A-D impacts vary due to the tools’ varying approaches to Module D.
- It can be seen in the graphs that including Module D increases the total GWP for the LCAs done in tallyLCA and Athena, while it slightly decreases total GWP in One Click LCA. This is due primarily to how these tools treat rebar in Module D. Athena considers a positive Module D value for steel products when the recycled percentage at end-of-life is less than the input recycled percentage (see notes in commentary above). It is likely that tallyLCA does the same. It is not clear what One Click LCA’s assumptions are.
- Athena IE and tallyLCA do not include post-tensioning, so the LCA practitioners substituted a miscellaneous hardware figure for Athena IE and rebar for tallyLCA.
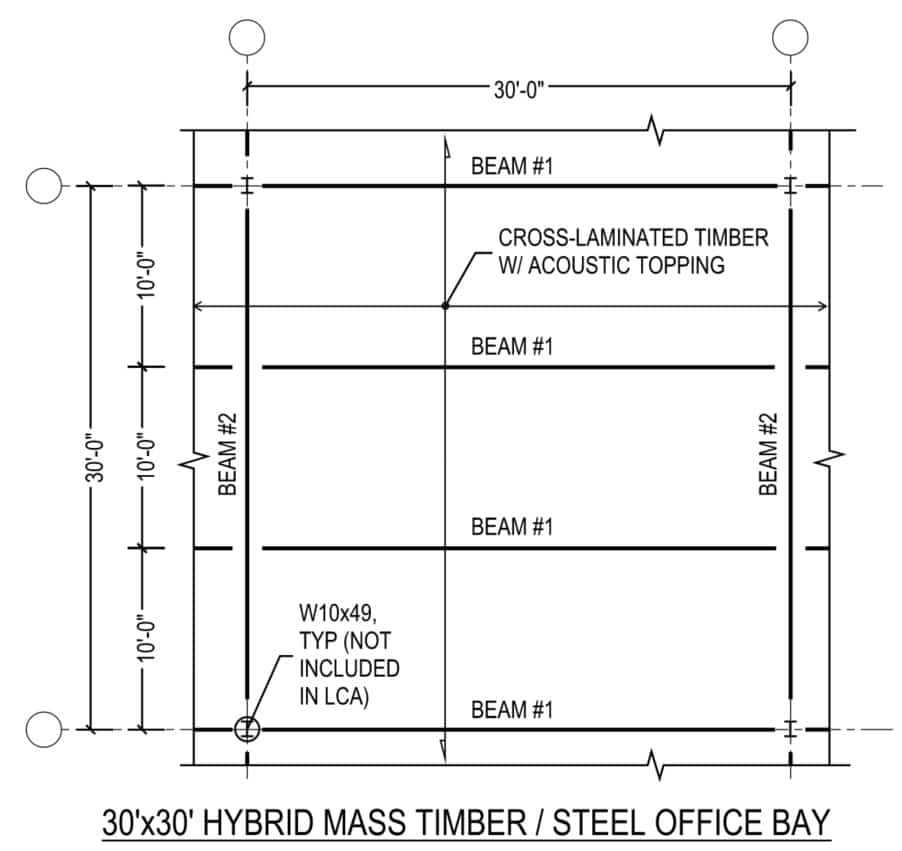
30'x30' Hybrid Mass Timber / Steel Office Bay
Bay Comparison Summary
| Bay Design #1 | Bay Design #2 | Bay Design #3 | |
| CLT | 3-Ply (4.14”) | 5-Ply (6.875”) | 3-Ply (3.43”) |
| Concrete Topping (Normal Weight) | 2”, 3000 psi (Non-composite) | 1.5”, 3000 psi (Non-composite) | 4”, 3000 psi (Composite) |
| Steel Framing | W27x84 girders
W21x44 beams (spaced at 10’-0” on center) |
W24x62 girders
W21x44 beams (spaced at 15’-0” on center) |
W18x60 girders
W18x40 beams (spaced at 10’-0” on center) |
| Steel Connections | 0.9 psf | 0.5 psf | 0.7 psf |
| Miscellaneous | N/A | ¾” Acousti-Mat | (60) ¾” x2” Welded Headed Studs |
Design Commentary
-
- One designer utilized an acoustic mat in conjunction with a thinner topping slab in their assembly while the other designers utilized thicker topping slabs without an acoustic mat to ensure acoustic performance. Specific STC/IIC ratings were not considered across designs.
- Steel framing members varied by bay, but were between 18” and 27” deep with varying flange widths.
- One designer utilized beams spaced at 15’-0” on center instead of the 10’-0” spacing originally included in the design prompt.
- Another designer utilized a composite floor system design that engages the concrete topping with welded headed studs along the length of the steel beams.
- The designers provided an estimated weight per square foot for steel connections.
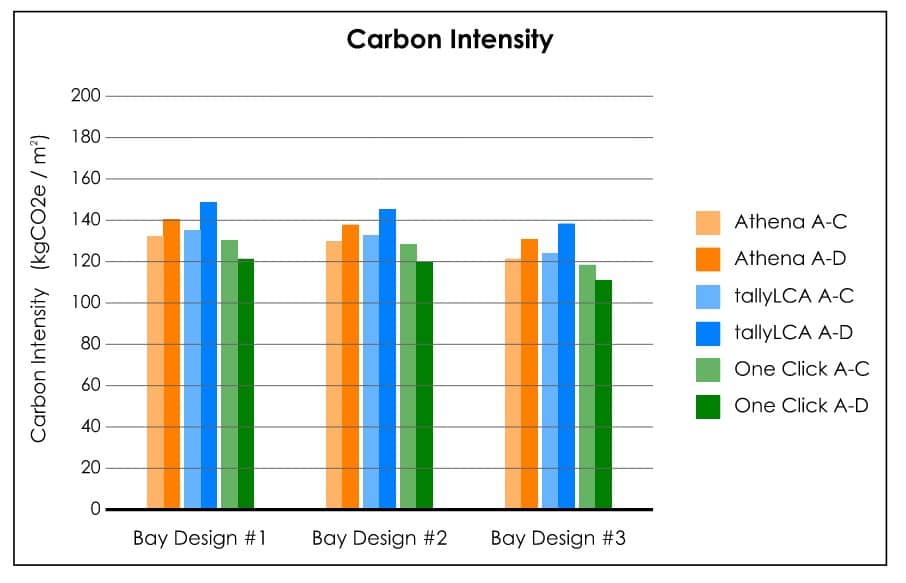
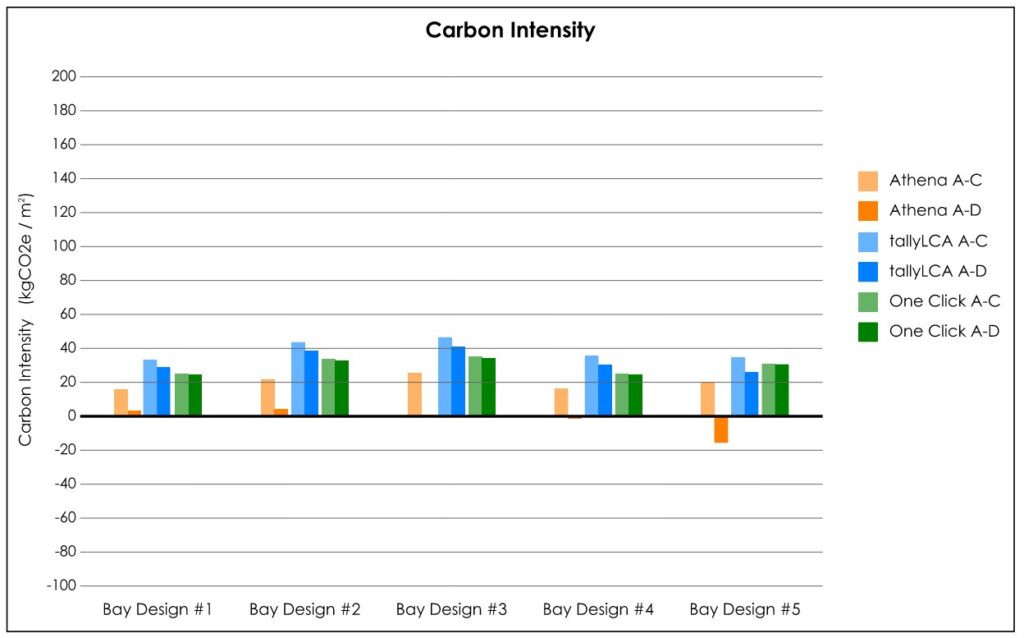
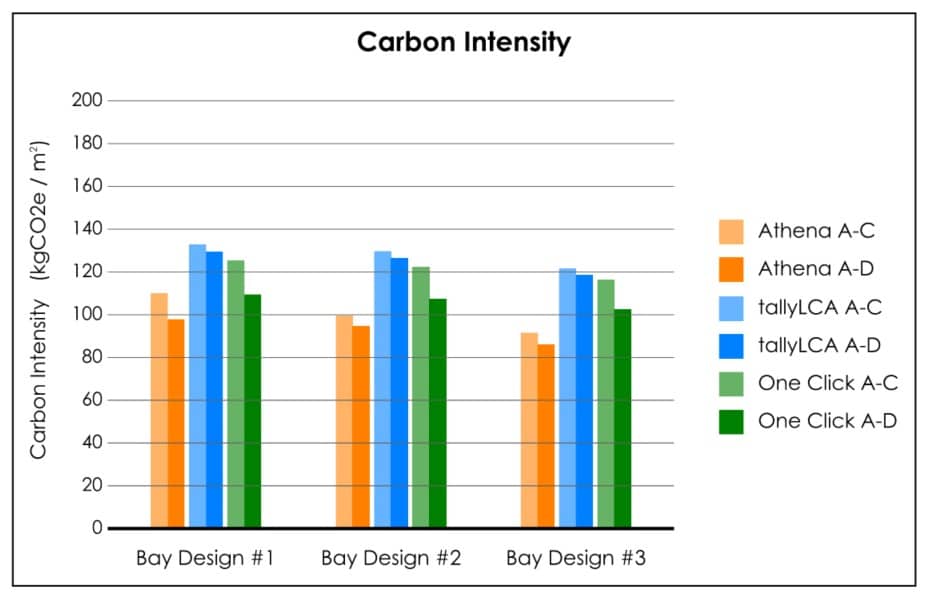
- For Bay #1, steel framing contributed the largest amount of embodied carbon overall. For Bay #2, CLT contributed the largest amount of embodied carbon overall. For Bay #3, the concrete topping contributed the largest amount of embodied carbon overall.
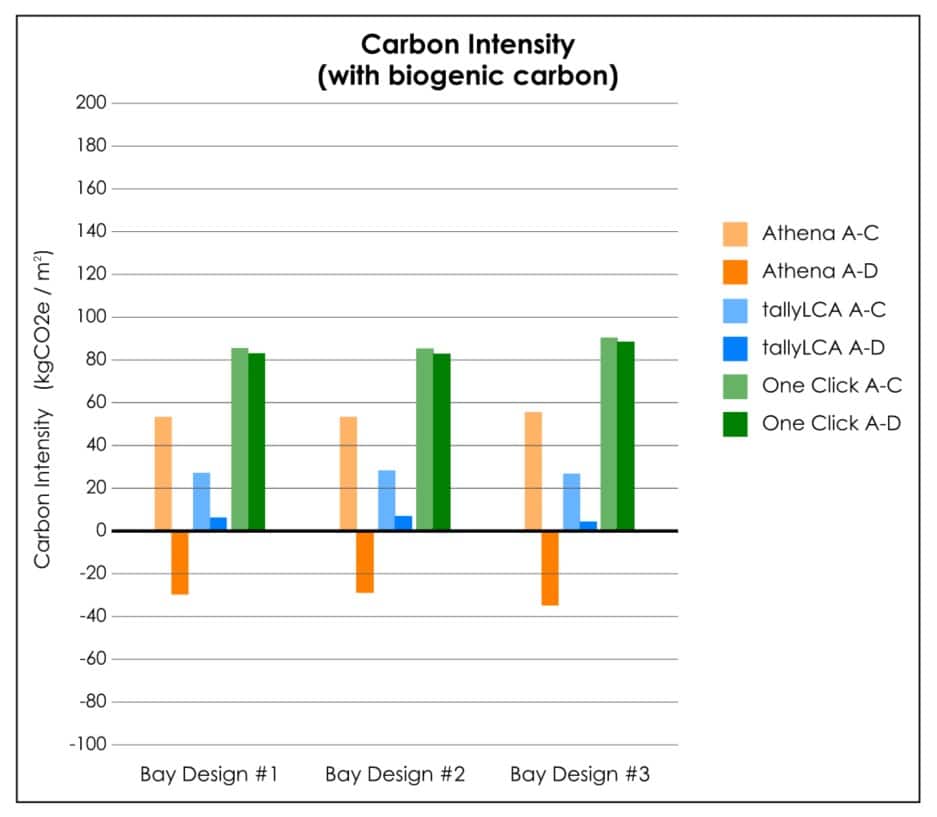
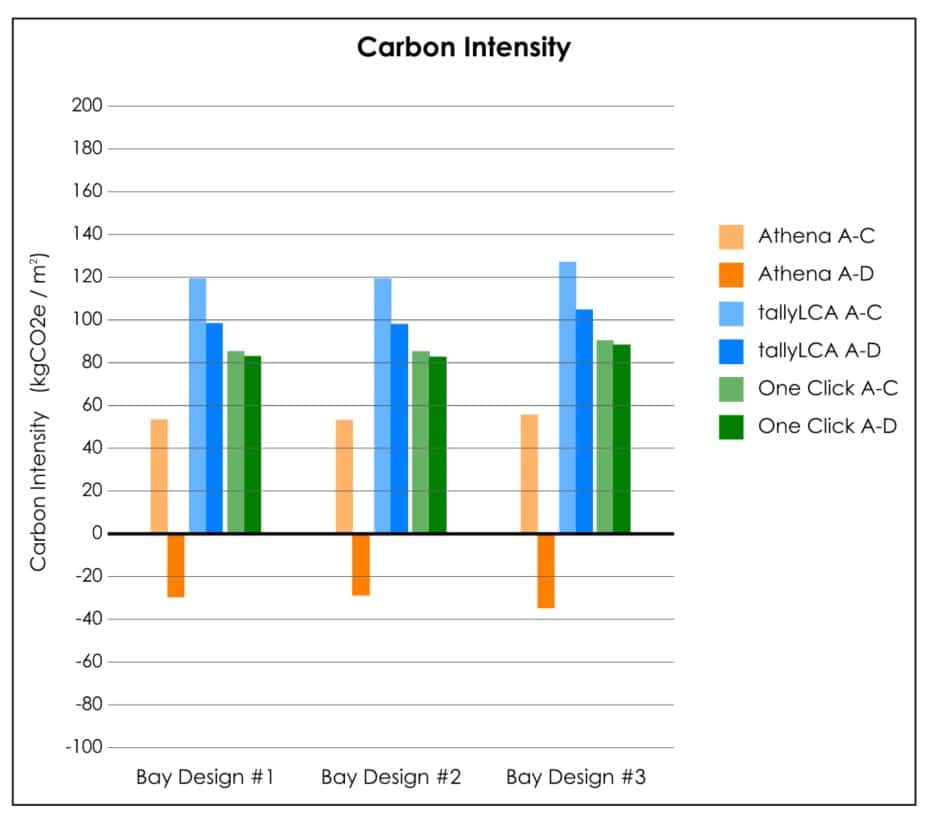
- When excluding biogenic carbon in tallyLCA, Bay #2 yielded the highest amount of embodied carbon followed by Bay #3 and Bay #1 from A-C, but yields the lowest amount of embodied carbon from A-D results using Athena IE.
- When including biogenic carbon in tallyLCA, Bay #2 yielded the lowest impacts followed by Bay #3 and Bay #1 because the biogenic carbon is directly tied to the volume of wood material and Bay #2 had about twice as much CLT in the floor assembly as Bay #1.
- Results are provided with and without biogenic carbon because tallyLCA has the option to either include or exclude biogenic carbon from their results. Athena IE includes permanently stored biogenic carbon by default in Module D and One Click LCA reports biogenic carbon storage separately, so it is excluded from these results. Reference the Biogenic Carbon section of the Tool Comparison for more information.
- A1-A3 GWP for the structural steel was comparable between Athena IE and tallyLCA, but about 30% higher for One Click LCA because different data sources were utilized.
- A1-A3 GWP of the CLT from One Click LCA was about twice as much as Athena IE, with tallyLCA landing approximately in the middle because different data sources were utilized.
- One Click LCA yielded the highest amount of embodied carbon, except in the case of Bay #2 when measured using tallyLCA. tallyLCA assumes almost 10 times as much impact for CLT in Stage C than One Click LCA, so tallyLCA yielded the highest amount of embodied carbon for Bay #2 because it contained the highest volume of wood compared to the other bays.
- Athena yields the lowest amount of embodied carbon in their results, except when biogenic carbon is included in tallyLCA A-C results.
- Athena demonstrates the largest discrepancy in A-C versus A-D results, with A-D results being much lower than A-C due to the permanent biogenic carbon storage included in Module D.
- Including biogenic carbon reduced the impact of the tallyLCA analyses by more than 50%.
Light Wood Framed Multifamily Residential Bay
Bay Comparison Summary
| Bay Design #1 | Bay Design #2 | Bay Design #3 | Bay Design #4 | Bay Design #5 | |
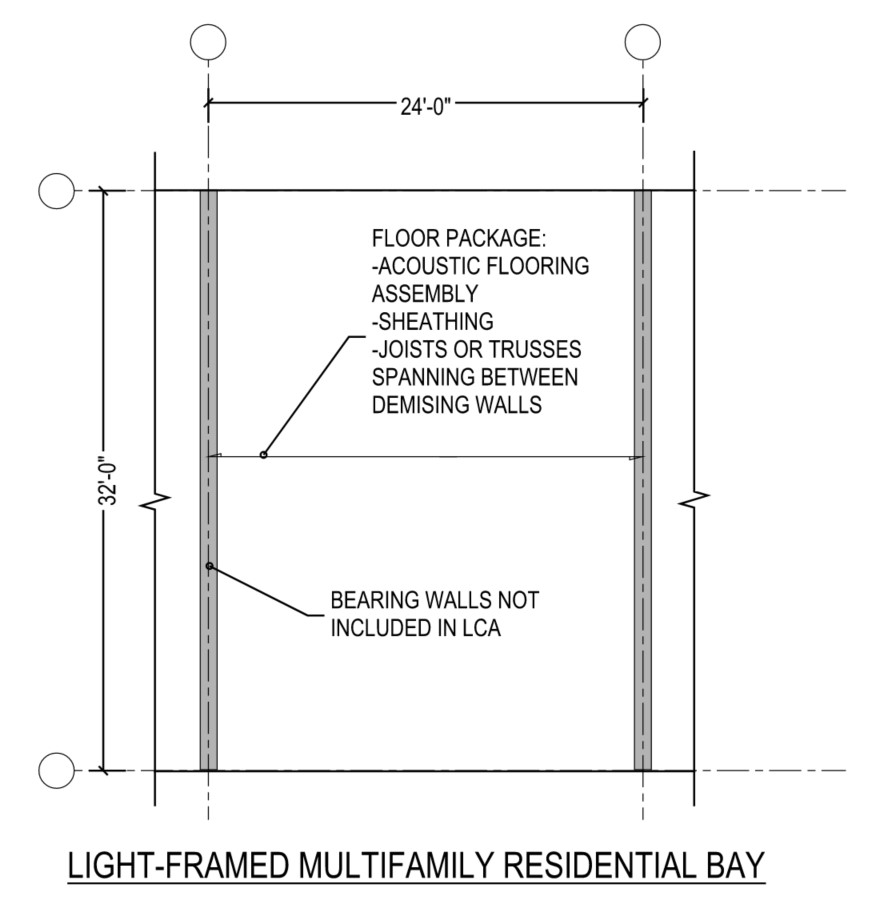
| Wood Joists | 16TJI360 @ 20” O.C. | 18TJI360 @ 16” O.C. | 16TJI560 @ 16” O.C. | 18TJI360 @ 16” O.C. | 24” Prefab. Wood Trusses @ 24” O.C. |
| Topping | 1” Gypcrete | 1 ½” Gypcrete | 1 ½” lightweight concrete | ¾” Gypcrete | ¾” Gypcrete |
| Wood Sheathing | ⅝” | ¾” | ¾” | ¾” | ¾” |
| Acoustic Mat | ¼” | ⅛” | N/A | ¼” | ¼” |
| Miscellaneous | N/A | Included wood web stiffeners at ends of joists. | Included metal joist hangers and wood web stiffeners at ends of joists. | N/A | Included volume of truss plate connectors. |
Design Commentary
-
- Designers typically specified joists that were 16” and 18” deep with varying flange widths. Bay #1 had a joist volume that was 20% below the average based on a 20” O.C. vs the typical 16” O.C joist spacing.
- Topping thicknesses varied by bay, but were typically gypcrete over an acoustic mat. Bay #3 omitted the acoustic mat in favor of a lightweight concrete topping, resulting in higher overall GWP.
- One designer chose to provide a prefabricated wood truss option (Bay #5) which maintained the same topping and sheathing as Bay #4. The volume of the wood trusses was approximately 40% higher than the average volume in the other bays.
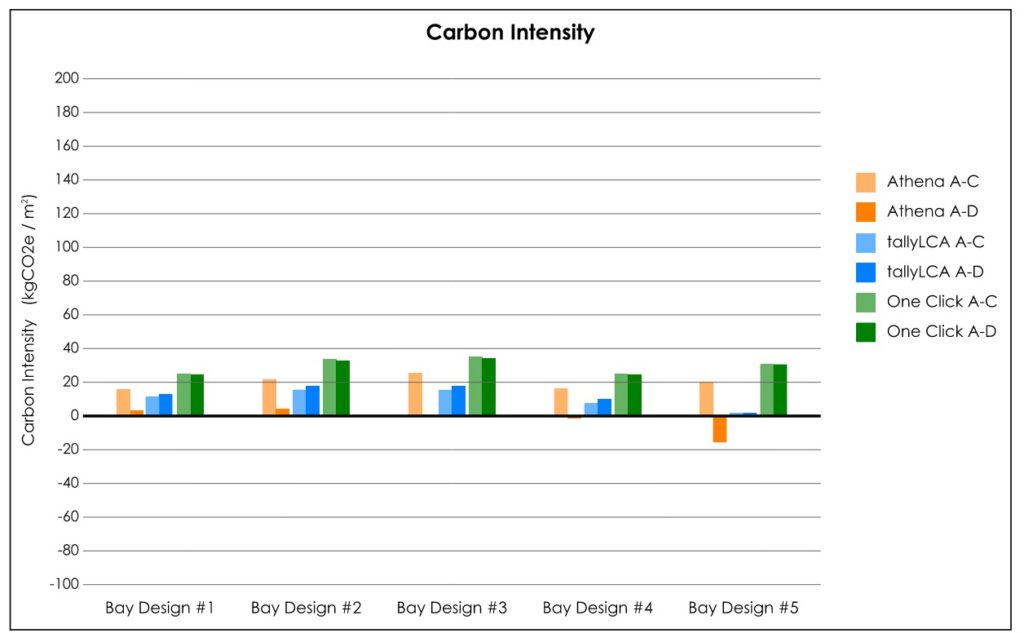
- The wood framing (joists/trusses and sheathing) accounted for approximately half of the total GWP in each bay.
- The largest individual contributor to the total GWP for each bay was the floor topping, exemplifying the importance of cementitious materials even in non-concrete systems.
- Some designers specified the need for shear blocks and joist hangers, which might be expected in all designs, though these were ultimately omitted from the LCAs at the LCA practitioner’s discretion. Light gauge joist hangers, in particular, would be expected to increase the overall GWP if they were included.
- Overall, when excluding biogenic carbon, tallyLCA yielded the highest outputs for each bay, followed by One Click LCA and Athena. Including biogenic carbon reduced the impact of the tallyLCA bays by more than half.
- Athena has the largest Module D reductions because Module D includes biogenic carbon in Athena.
- One Click LCA used a TJI-specific EPD. LCAs in Athena and tallyLCA separated the TJI volumes into LVL flange and plywood/OSB web volumes. Wood sheathing that was specified by the designers was either plywood or OSB. Only LCAs performed using Athena differentiated between the two materials; for tallyLCA and One Click LCA, the same EPD was used. GWP for the sheathing was comparable between Athena and One Click LCA, but notably lower for tallyLCA.
- Gypcrete GWP values were comparable for all three programs.
- One Click LCA had a prefabricated wood truss EPD which included the metal crimps. The Athena and tallyLCA analyses calculated the volumes and impact of the sawn lumber and crimps separately.
Other Notes
- Initial LCA results varied widely between the LCA programs because some LCA practitioners selected unrealistic proxies for the acoustic mat material which caused this material to contribute excessively to the results. A decision was made by the Resources Group to normalize the acoustic mat impact across all bays. A Pliteq GenieMat product of comparable thickness was substituted into each analysis.
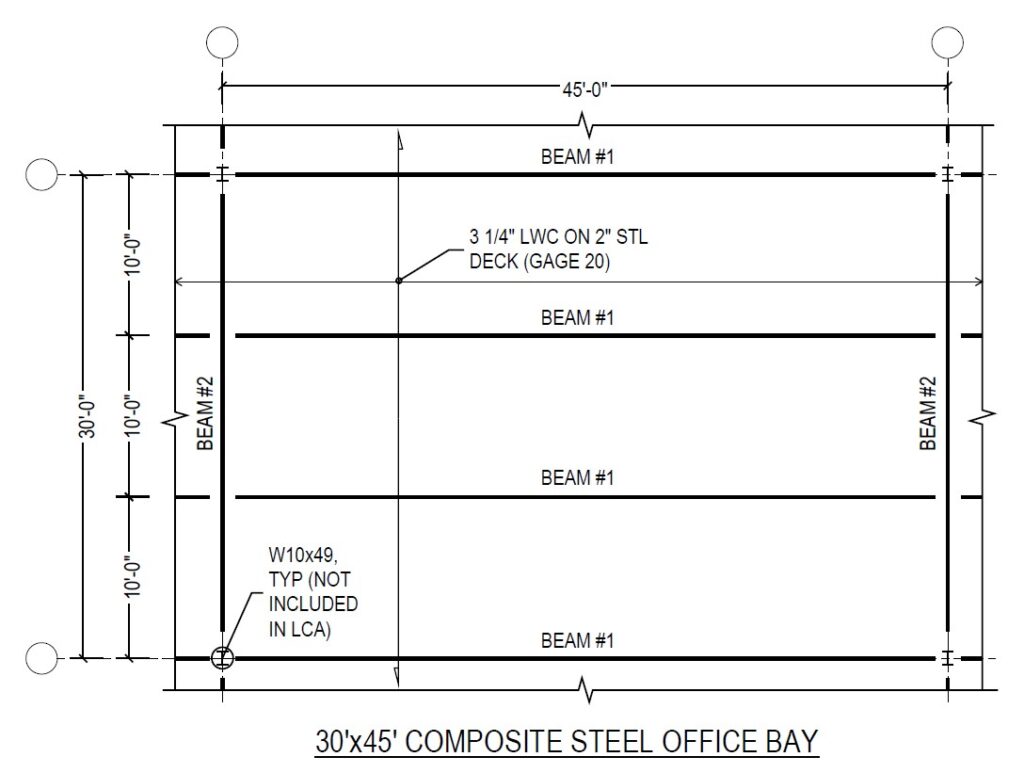
30'x45' Composite Steel Office Bay (Round 1)
- Steel
- ASTM A992
- Beam #1: W21x44 to W24x55
- Beam #2: W24x62 to W21x93
- ¾”Øx4” Headed Studs: 146 to 182
- Steel Connections: 0.06 to 0.25 psf
- Steel Deck
- ASTM A653
- 2” Galvanized Composite Decking, 20 GA
- Concrete
- 3,000 psi Lightweight (115 pcf), 20-29% SCMs
- Grade 60 Rebar: 0.00 to 0.15 psf
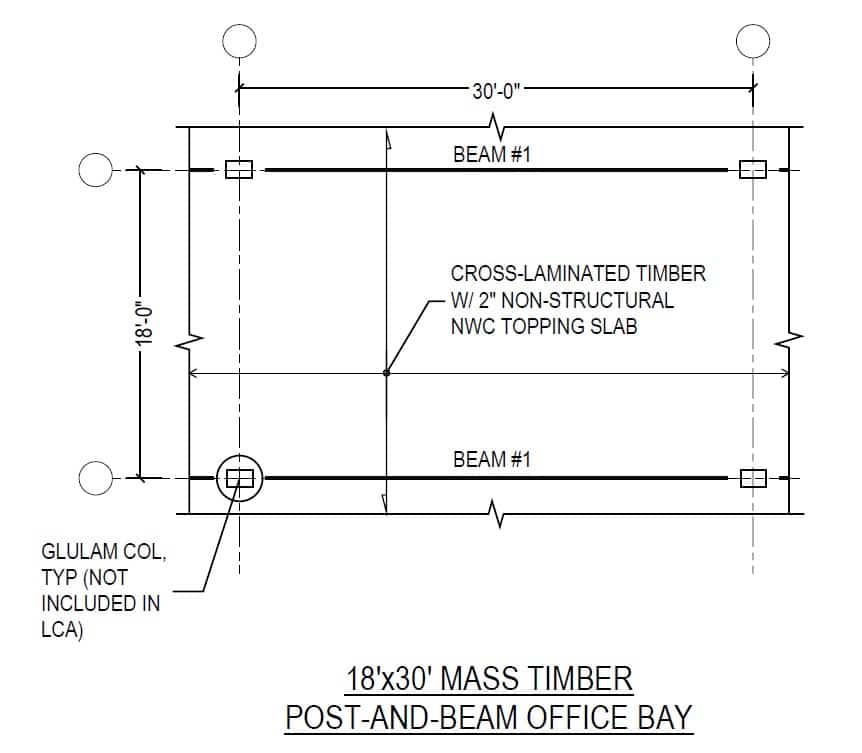
18'x30' Mass Timber Office Bay (Round 1)
- Mass Timber
- Beam #1: 24F-V4 (DF) – 8.75”x31.5” to 10.25”x30”
- CLT: V2 or E1 (SPF) – 5-PLY (6.90”) to 7-Ply (7.56”)
- Steel Beam-Column Connection: 125 to 200 lbs
- Concrete Topping
- 3,000 psi Normalweight, 20-29% SCMs
- WWR 6×6 W1.4xW1.4
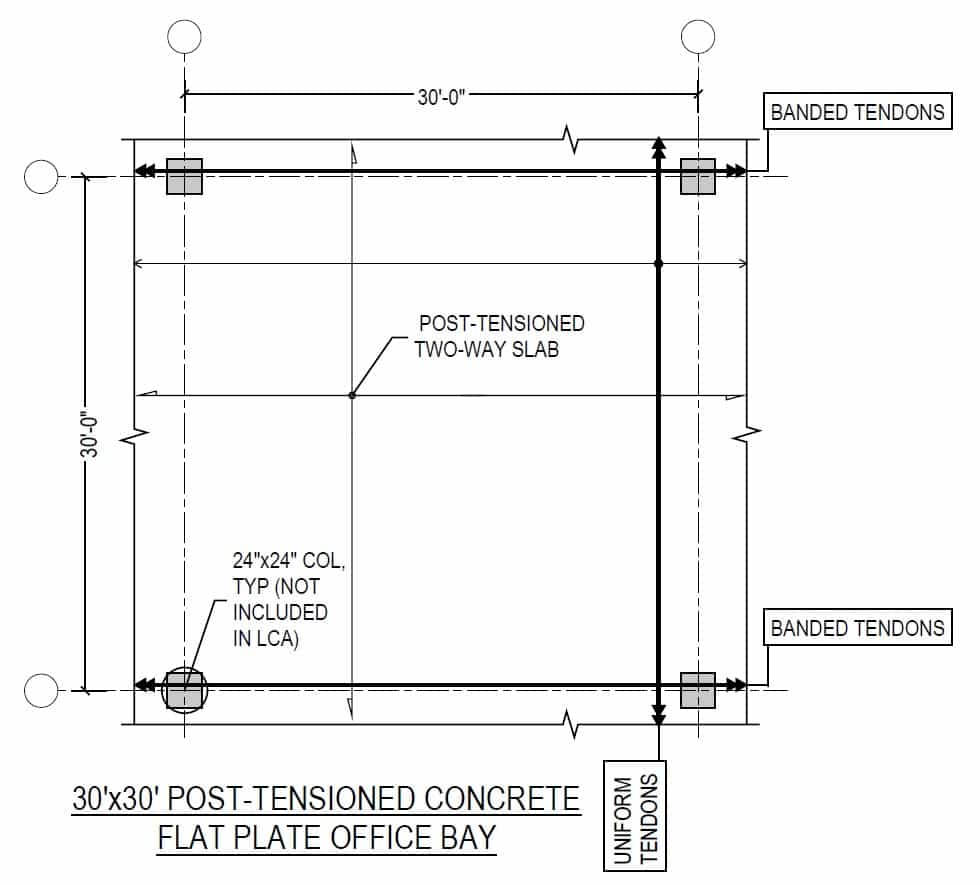
30' x 30' Post-Tensioned Concrete Office Bay (Round 1)
- Concrete
- 6,000 psi Normalweight, 0% SCM: 8” thick
- Reinforcement
- ½”Ø 7-Strand, 270 ksi Post-Tensioning Tendons
- Banded Tendons Per Column Line: 17 to 22
- Distributed Tendons Per Bay: 17 to 22.5
- ASTM A615, Grade 60 Rebar: 0.55 to 3.45 psf
- Stud Rail Assembly Per Column: 10 to 96 lbs


