page-header

EMBODIED CARBON INTENSITY DIAGRAMS

Included on this page are links to Embodied Carbon Intensity Diagrams (ECIDs) for some typical framing schemes for various building types.

The main intent of these diagrams is educational, and to provide a range of embodied carbon values for the analyzed bays to inform the practicing structural engineer of embodied carbon intensity for framing schemes considered typical. 

These could also be used to back check your own assessments or even as a general guide for early design embodied carbon estimates.

The development of SE 2050’s Embodied Carbon Intensity Diagrams (ECIDs) focused on a couple of goals. First, gravity floor framing structure accounts for a large percentage of embodied carbon in most buildings, so understanding the rough order of magnitude (ROM) of embodied carbon in various common floor systems is useful. Secondly, as was observed in the prior round of ECIDs, inconsistencies in how structural engineers approach design can introduce an added layer of variability in embodied carbon results.  Thus, a process was established to generate  diagrams that better reflect real world variation in designing and analyzing structural systems for embodied carbon. In this way, the ECIDs not only become a library of ROM embodied carbon intensities for typical floor bays, they are also intended to bring attention to this additional source of variability that is not often accounted for in other studies.

The process for generating the data in these ECIDs was as follows:

  • SE 2050 Committee members wrote the design rules for the bays and established the parameters for each bay.
  • At least three structural engineers were tasked with designing a “typical bay” of given dimensions and with a specific framing system.
  • A life cycle assessment (LCA) was conducted on each of the designs by an experienced practitioner. Each practitioner used a different LCA software: Athena Impact Estimator (IE), TallyLCA, and One Click LCA.
  • Results (at least 9 LCAs per bay) were compiled and summarized.
  • The LCA data was compiled and then members of the committee dug into the data to establish trends, causes for seemingly incongruent results, etc.

These analyses include only the horizontal framing inside one typical interior bay.  Vertical members such as columns are not included.  Other elements such as lateral members, foundations, and non-structural elements are not included.  These findings are not meant to be extrapolated to full buildings.

ECIDs are for educational purposes only.  SE 2050 recognizes that represented bays are not functionally equivalent and therefore direct comparisons between them should not be made.  The ECIDs should not be used to compare dislike materials.

Below are the different framing plans considered. See more info in the link here.

  • Mild-Reinforced Concrete Flat Plate Multifamily Residential – 24’ X 24’
  • Concrete Joist Office – 30’ X 45’
  • Mass Timber / Steel Office – 30’ X 30’
  • Light Wood Framed Multifamily Residential
  • Composite Steel Office – 30’ X 45’
  • Mass Timber Office – 18’ X 30’
  • PT Concrete Flat Plate Office – 30’ X 30’

ECIDs Summary

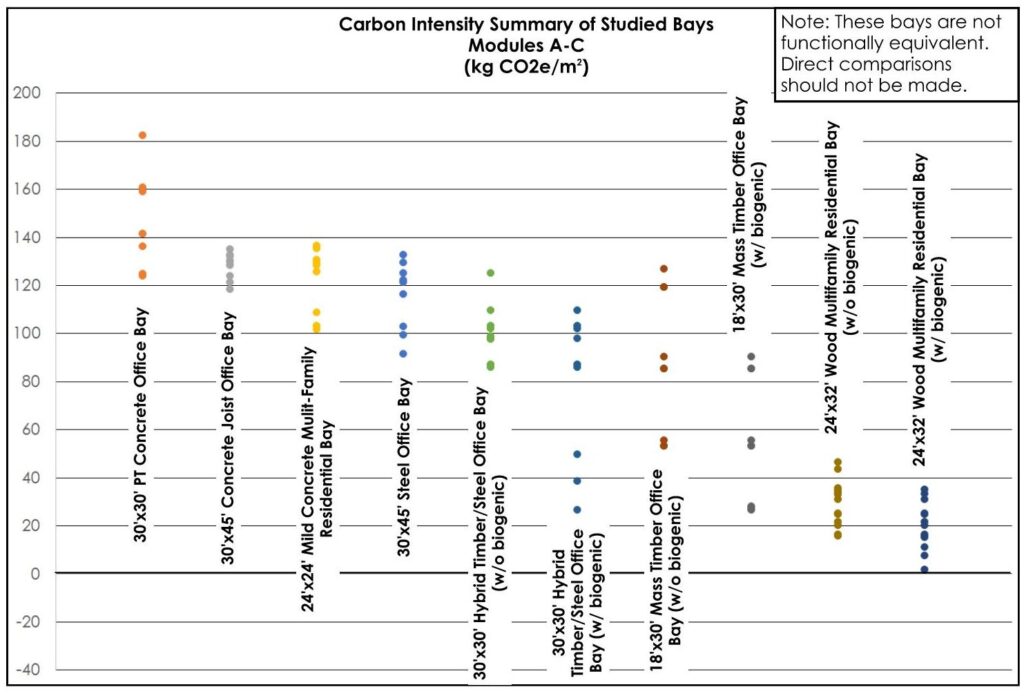
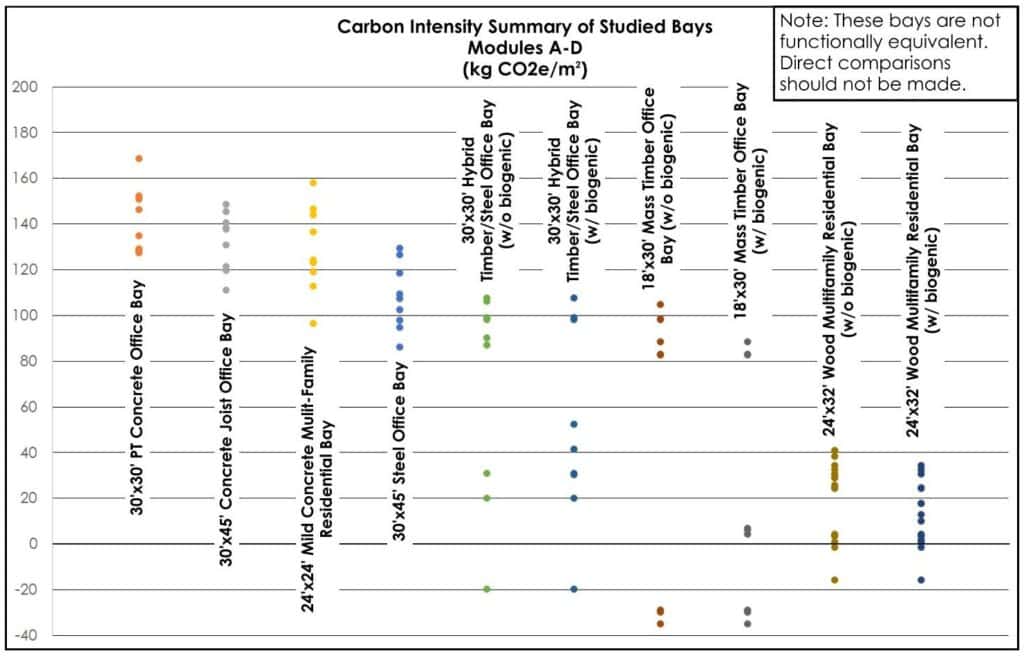
The following graphs summarize the results of all seven ECID studies to date. Concrete-framed systems are shown in blue, steel in yellow, and timber in green. Note that the bays are not functionally equivalent, so direct comparisons should not be made between the different systems.

Key Takeaways

  • The framing system and bay layout chosen has a big impact on embodied carbon, but there also exists room for carbon optimization by structural engineers within set boundaries.
  • Commercially available LCA softwares sometimes use different LCI databases for materials, and LCA technicians must employ judgment when performing LCAs, leading to variation in GWPs
  • The decision to include or exclude the effects biogenic carbon has a large impact on timber structures
  • When including Modules A-C:
    • The embodied carbon of concrete-frames and steel-framed systems range from about 85 to 180 kg CO2e/m2 when biogenic carbon is not included. When biogenic carbon is included, the hybrid steel-CLT system’s embodied carbon ranges from about 25 to 110 kg CO2e/m2.
    • The embodied carbon of the wood-framed systems varies from about 10 to 130 kg CO2e/m2 without biogenic carbon and -100 to 35 kg CO2e/m2 with biogenic carbon included.
  • For Modules A-D:
    • The embodied carbon of concrete-frames and steel-framed systems range from about -20 to 170 kg CO2e/m2 when biogenic carbon is not included. When biogenic carbon is included, the hybrid steel-CLT system’s embodied carbon ranges from about -20 to 110 kg CO2e/m2.
    • The embodied carbon of the wood-framed systems varies from about -35 to 105 kg CO2e/m2 without biogenic carbon and -100 to 35 kg CO2e/m2 with biogenic carbon included.
    • With Module D included, even hybrid steel-framed/CLT construction can be carbon-negative

Future Work

The SE 2050 Committee plans to expand both the breadth and depth of this study.  Please look out for additional typical bays and insights.

The following individuals made substantial contributions to the embodied carbon intensity diagrams.

Mark Webster, Simpson Gumpertz & Heger

Jessica Martinez, DCI Engineers

Justin Sharkey, Holmes Structures

Swarna Karuppiah, Datum Engineers

Priyal Shah, Atelier Ten

Julia Hogroian, Simpson Gumpertz & Heger

Nick Pauli, Lionakis

Joseph Dowd, Walter P. Moore

Gina Kope, Holmes Structures

Mithila Madhavan, LeMessurier

Sitanan Tanyasakulkit, Grim & Chen Structural Engineering

Paul Stukas, Buehler Engineering

Ty Billings, Thornton Tomasetti

Brian McSweeney, Ehlert Bryan Engineering ConsultingTLC Engineering Solutions

Dirk Kestner, Walter P. Moore

Kelsey Price, HinesMagnusson Klemencic Associates

Matt Kantner, EQUILIBRIUM Consulting Inc.

Megan Stringer, Holmes Structures

Russ Miller-Johnson, Engineering Ventures

Jay Arehart, University of Colorado Boulder

Ruthwik Chepuri, Walter P Moore

Victoria Herrero-Garcia, Mead & HuntAmbient Energy

Back to top of page